Indicator Widgets
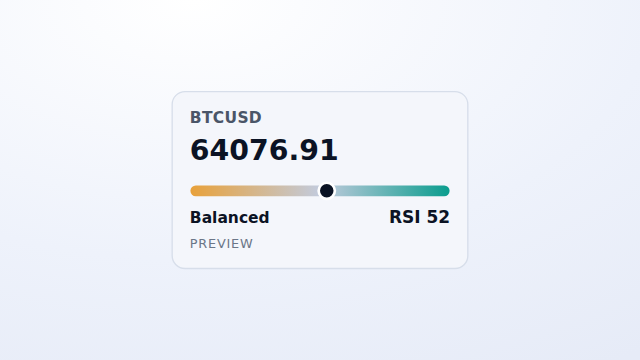
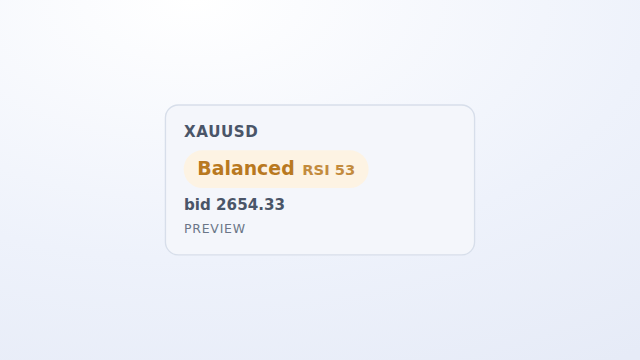
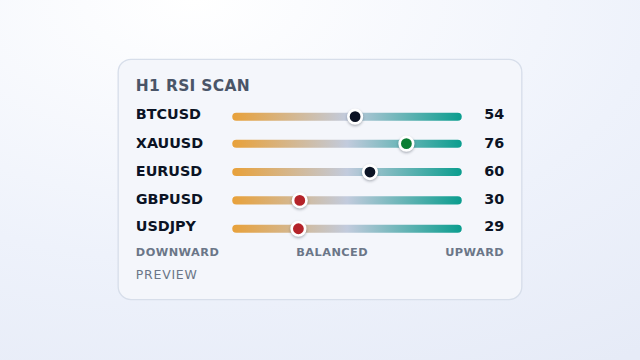
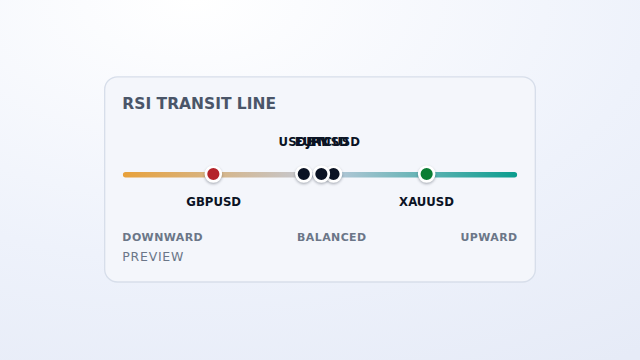
Embed technical-indicator context on your site with one script tag — the values are computed server-side, so there is no indicator math or chart library on your page. These widgets read H1 RSI, MACD sign, and ADX trend strength across the instruments we cover: a single-asset price-plus-RSI panel, a multi-timeframe RSI ladder, a shared-scale pressure map across markets, a strongest-signal one-liner, a watchlist grid, and a transparent condition screener. A trading-education page can explain RSI on a real live instrument; a broker landing page can showcase multi-indicator coverage; a market dashboard can scan the universe for one stated condition. Indicators are shown as labelled context — never a signal, forecast, or recommendation. Each runs in a sandboxed frame with no third-party branding, from public market data through our hosted gateway. Preview with no key; add your key to go live per domain.
- Sandboxed shadow-DOM — no CSS or JS collisions
- No third-party branding
- Preview needs no key
- Billed per domain, monthly
10 widgets for this
Each links to its own page — a live preview, the embed snippet, and a plain data contract.
-
-
-
 Available
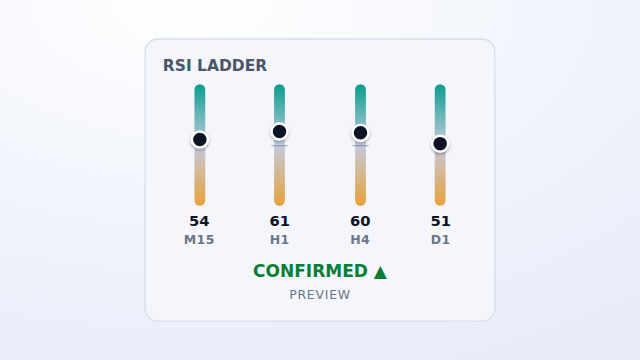
Multi-Timeframe RSI Widget
RSI_14 across M15 / H1 / H4 / D1 · one symbol.
$9.99 /mo Get it → -
 Available
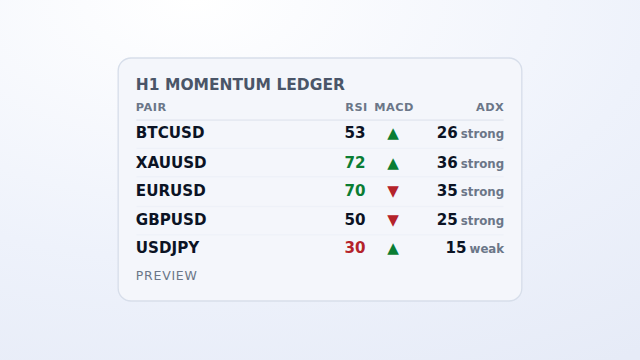
RSI MACD ADX Comparison Widget
RSI + MACD sign + ADX · H1 · several symbols.
$14.99 /mo Get it → -
-
-
 Available
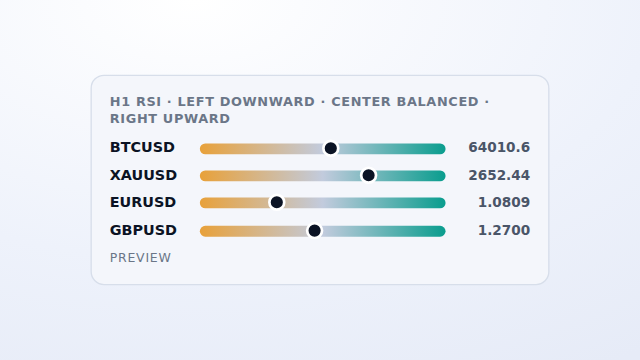
Multi-Market RSI Pressure Map Widget
Bid + H1 RSI on a shared scale · several symbols.
$14.99 /mo Get it → -
 Available
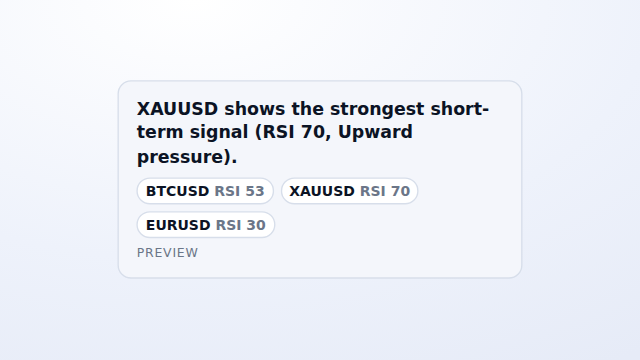
Strongest RSI Signal Widget
H1 RSI across symbols → furthest-from-neutral.
$14.99 /mo Get it → -
 Available
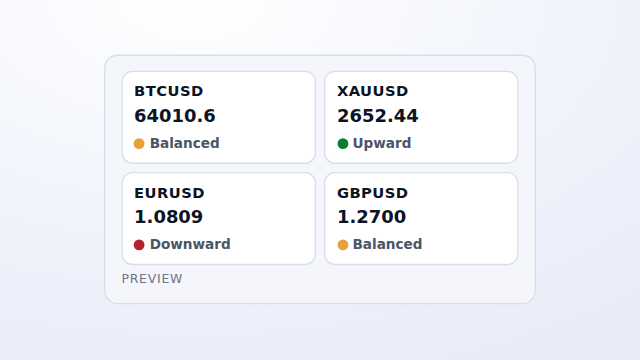
Market Watchlist Grid Widget
Quote + H1 RSI per tile · up to six symbols.
$14.99 /mo Get it → -
 Available
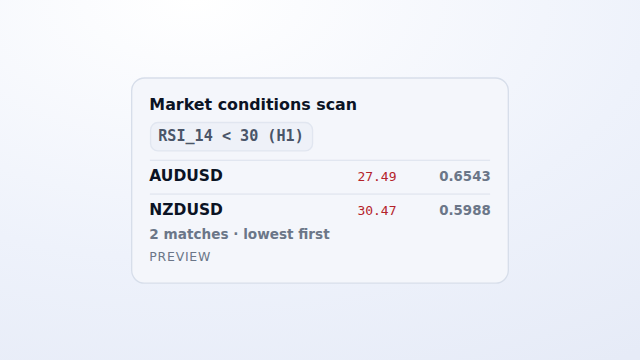
Forex Indicator Screener Widget
Symbols meeting a stated indicator threshold.
$14.99 /mo Get it →
Prefer the raw API?
Every widget here is backed by data you can also pull directly. These endpoints and guides cover the same market data.
Embed a financial widget in minutes
Preview any widget with no key, then add your key to go live on your domains.